The Bitcoin network clocked 432,613 transactions on Sunday the 23rd of April, according to data presented by crypto analytics firm Glassnode.
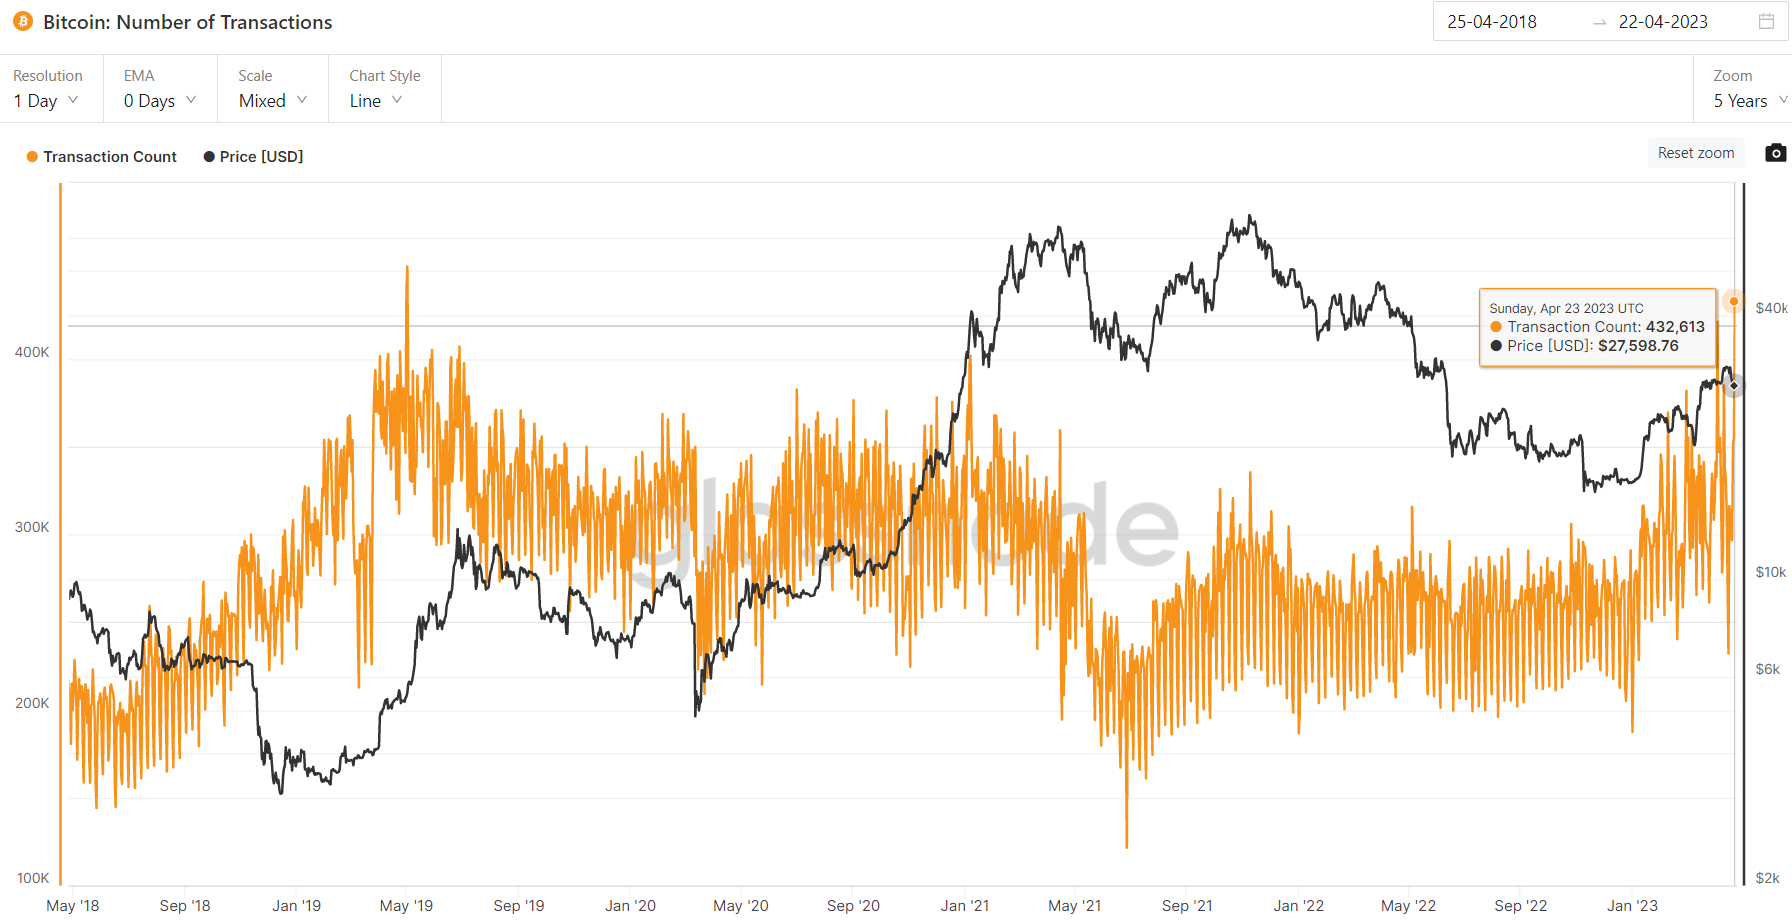
That’s the third-highest daily transaction count in the Bitcoin network’s history and the highest since the early May 2019 peak of 452,462.
The spike in network activity, which has also pushed the 7-Day Exponential Moving Average (EMA) of daily transactions to above 350,000 (its highest since December 2020), comes despite a recent pullback in the Bitcoin price from the 10-month highs it hit earlier this month to the north of the $31,000 level.
The BTC price was last changing hands in the $27,300s, with prices having found solid intra-day support around the $27,000 level.
The rise in network activity in recent months demonstrates that demand to utilize the Bitcoin network as a settlement layer is robust and improving, a positive sign for the world’s first and largest cryptocurrency by market capitalization.
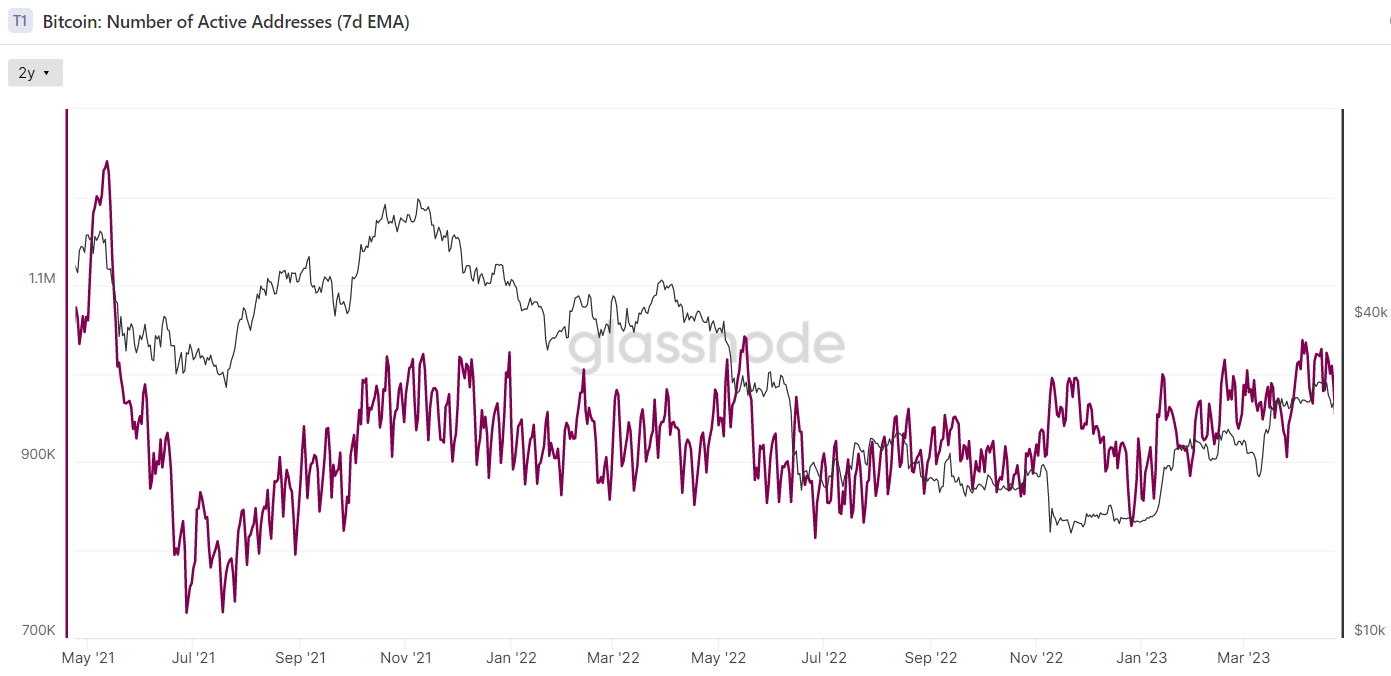
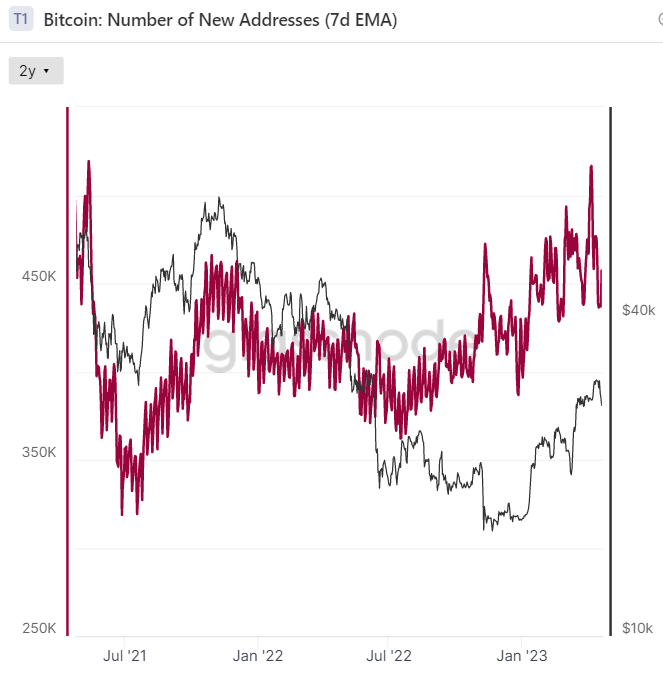
Other metrics of network utilization have also been trending higher in recent months, including the number of active addresses, the number of new addresses and the number of addresses holding a non-zero BTC balance.
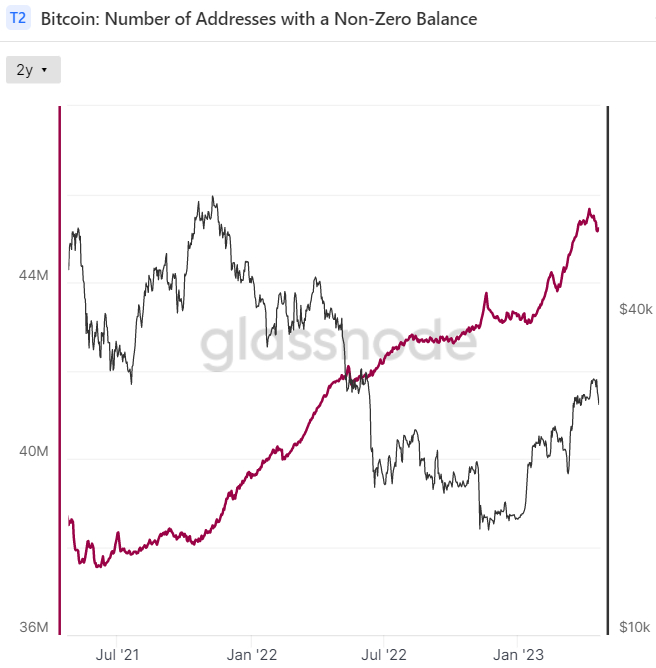
Positive On-Chain Trends Bode Well for the BTC Price
Measures of network utilization aren’t the only on-chain metrics that bode well for the Bitcoin price.
Metrics tracked in Glassnode’s Recovering from a Bitcoin Bear dashboard that include those pertaining to a return of market profitability, the balance of USD-denominated Bitcoin wealth and where spot prices are trading relative to key pricing models have been sending a strong signal in recent weeks that the Bitcoin bear market is now well behind us, and that Bitcoin is likely in the early stages of a new bull run higher.
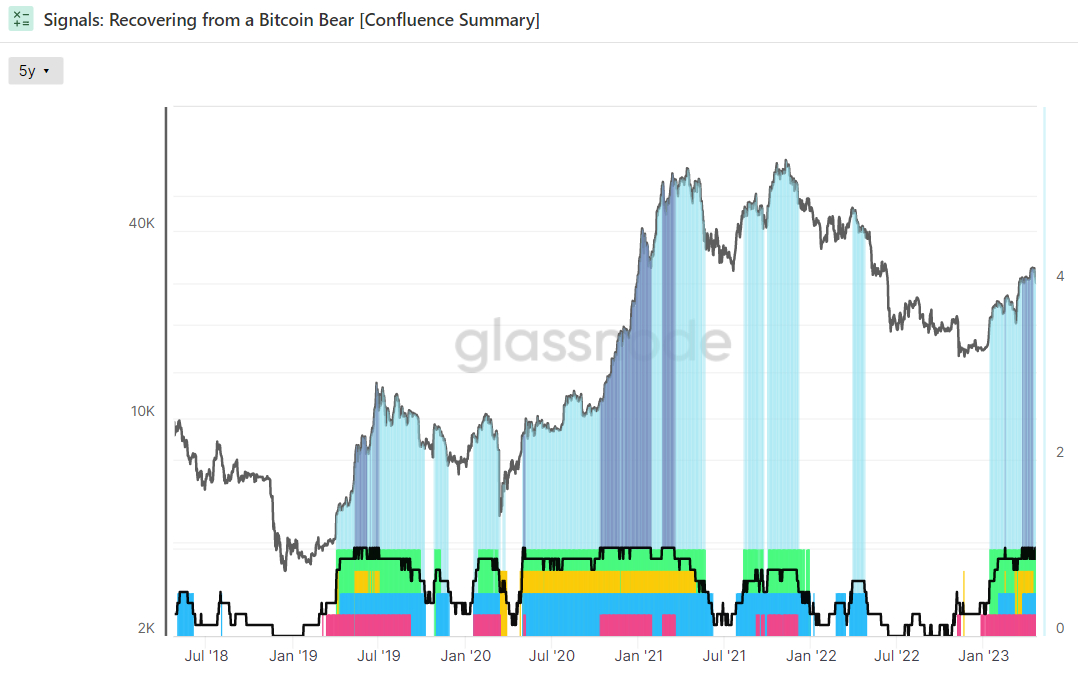
As of Sunday, seven of eight indicators were flashing green, though in recent weeks all indicators have been flashing in unison on a frequent basis for the first time in more than two years.
Bitcoin’s strong rebound in 2023, which has seen BTC rally around 65% year-to-date, comes amid expectations that the end of the Fed’s interest rate tightening cycle (the main bearish headwind of 2022) is close to ending and after cryptocurrency markets arguably became well oversold at the end of last year in wake of the collapse of FTX.
Safe-haven demand has further boosted the BTC price amid concerns that the traditional banking sector might be in trouble in wake of a spate of US bank collapses in early March, though regulatory uncertainty amid a barrage of US SEC enforcement action has kept a lid on the upside.
But as global crypto adoption continues to move in the right direction and macro/on-chain conditions shift favorably, the outlook for the BTC in the medium to long term remains strong.
How High Can Bitcoin Go This Bull Market?
Assuming the Bitcoin bull market is back, how high can BTC go this cycle?
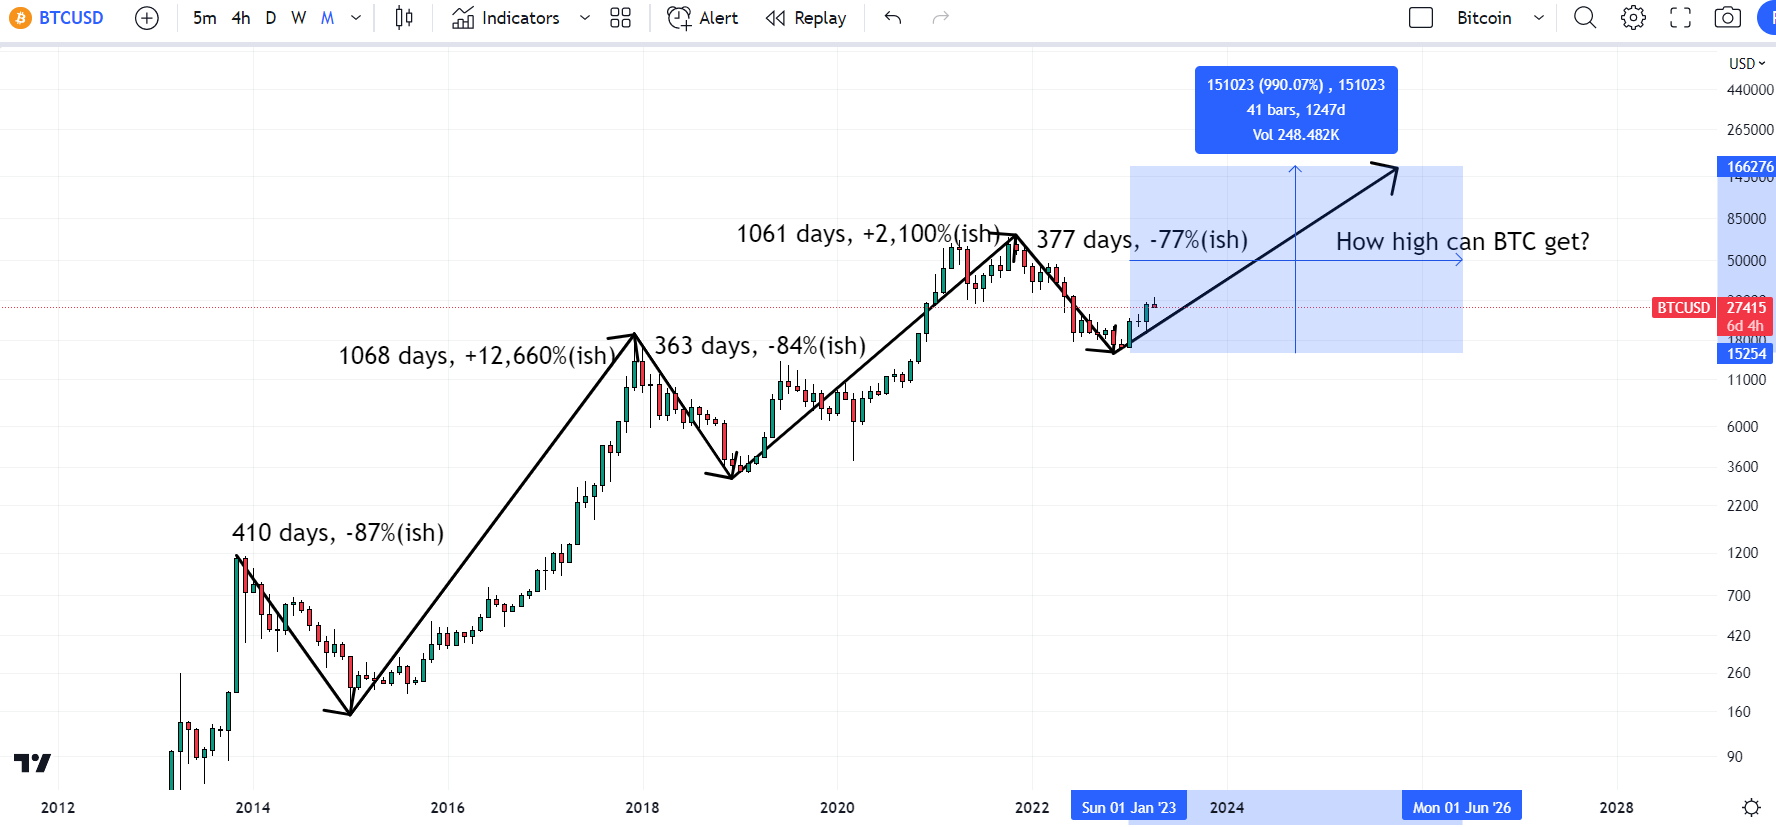
We can arrive at a guestimate by looking at Bitcoin’s past two market cycles, both of which lasted approximately four years.
From the bottom of the 2015 bear market to the top of the 2017 bull market, Bitcoin gained a staggering more than 12,500%.
From the bottom of its 2018 bear market to the top of its 2021 bull market, Bitcoin gained a still impressive 2,100%.
Assuming diminishing returns from each bear market comeback continue, could Bitcoin perhaps be looking at a 1,000% (11x) bounce from its 2022 lows?
That would imply Bitcoin reaching the $165,000 area sometime in the next few years.
Other more widely followed Bitcoin pricing models are sending a potentially more bullish story.
According to the Bitcoin Stock-to-Flow pricing model, the Bitcoin market cycle is roughly four years, which shows an estimated price level based on the number of BTC available in the market relative to the amount being mined each year.
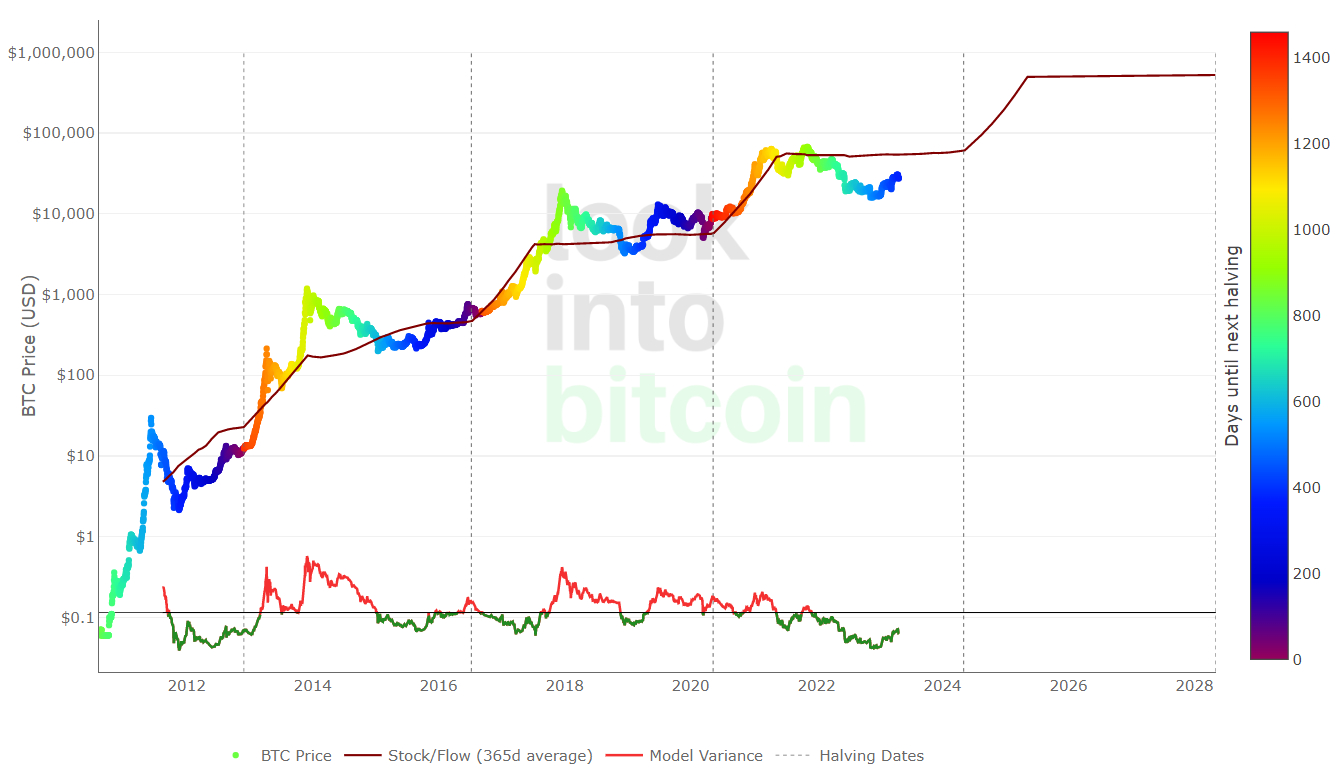
Bitcoin’s fair price right now is around $55K and could rise above $500K in the next post-halving market cycle – that’s around 20x gains from current levels.
Finally, Blockchaincenter.net’s popular Bitcoin Rainbow Chart shows that, at current levels, Bitcoin is in the “Accumulate” zone, having recently recovered from the “Basically a Fire Sale” zone in late 2022. In other words, the model suggests that Bitcoin is gradually recovering from being highly oversold. During its last bull run, Bitcoin was able to reach the “Sell. Seriously, SELL!” zone.
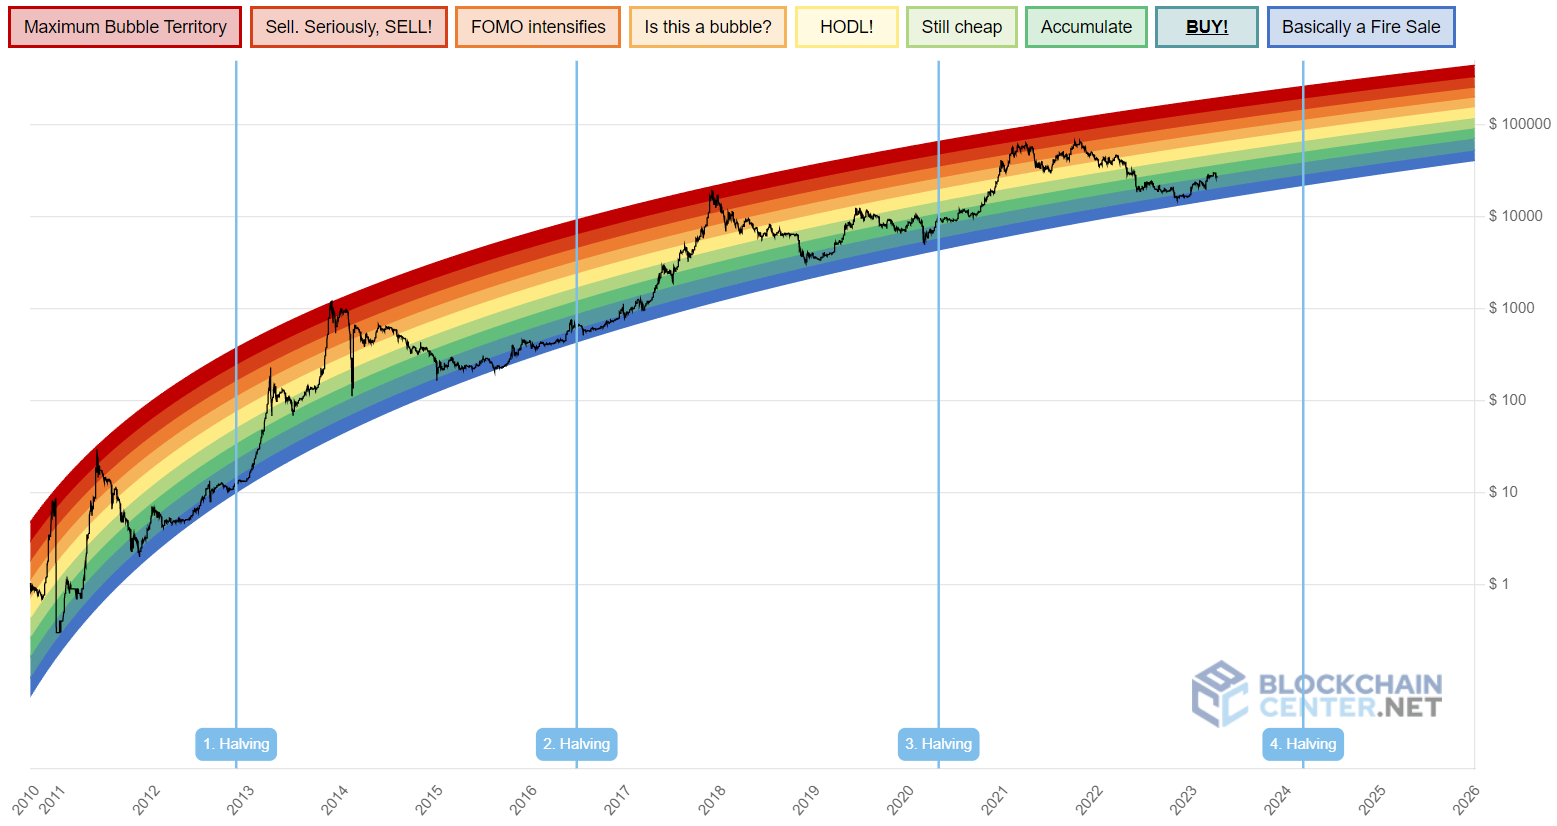
If it can repeat this feat in the next post-halving market cycle within one to one and a half years after the next halving, the model suggests a possible Bitcoin price in the $200-$300K region. That’s around 7-10x gains from current levels.
Credit: Source link


